Interactive Brazilian Map
ABOUT Maps
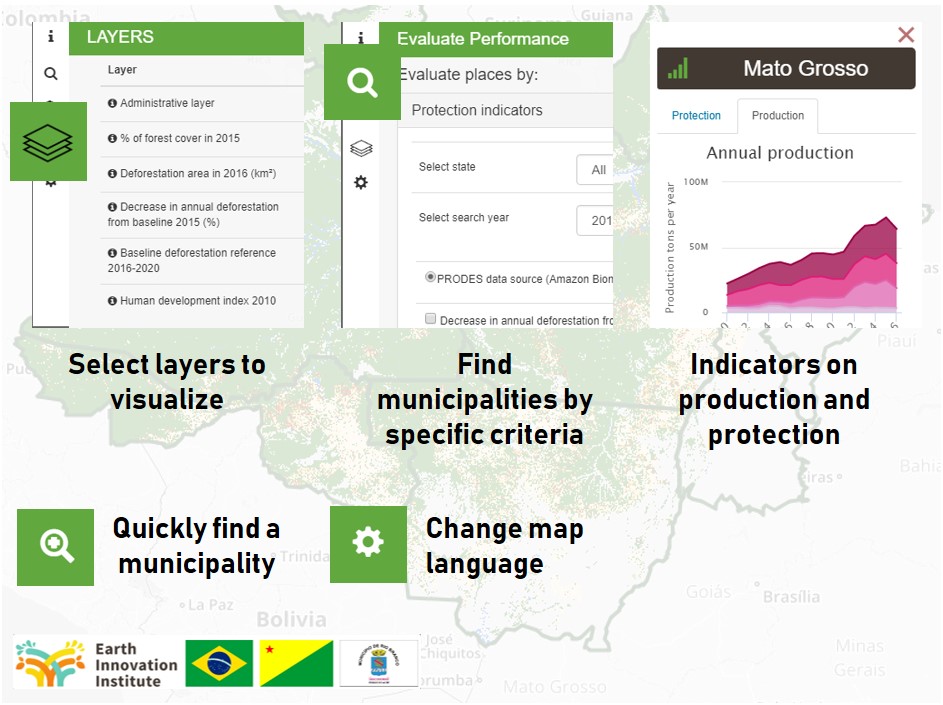
This interactive map facilitates tracking progress in key jurisdictions toward sustainable rural development by evaluating forest protection, agricultural and social indicators in past years.
We aggregate credible data to create a spatio temporal application to monitor and report on the jurisdictional progress towards territorial sustainability goals. Efficient monitoring at the territorial scale can strengthen multi-sector commitments to achieve deforestation goals and facilitate the delivery of incentives to the rural economy actors that need to make the transition to low-emission, low-deforestation production systems.
This interactive map allows you to evaluate indicators on forest protection, agricultural production, and social indicators in each of the states and municipalities over the last years. The map focusses on the Amazonian jurisdictions
How to use this tool?
Use the available layers or define specific search criteria to identify municipalities performing according to your definition. Click on any state or municipality to see the production and forestry indicators on the right panel. For a detailed explanation of the platform visit our youtube channel.