Summary
| Indicator | Value |
|---|
Deforestation and agricultural value
% of tropical forest as part of the country
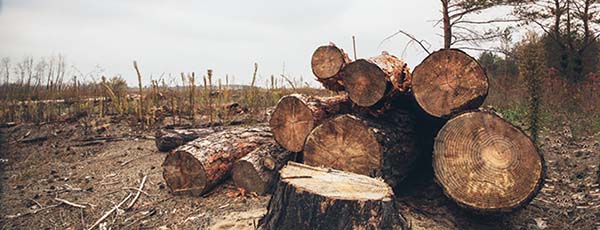
Annual deforestation area
The plot illustrates the yearly deforestation area measured over the last years in the state. Activate the line series to visualize the accumulated deforestation in the state.
Hansen data provides an alternative measurement of vegetation loss which is done at a global scale using LandSat data and automatic algorithms (Hansen, UMD). We further processed Hansen data to include only tree cover loss in areas defined as forest.
Annual deforestation rate(%)
The plot illustrates deforestation percentage rates in the state over the last years. To compute this indicator the yearly deforestation observed in the state is divided (normalized) by the remaining forest.
Deforestation Reference level (FREL)
A national forest reference emission level and/or forest reference level is one of the elements formulated by developing country Parties implementing REDD+ activities and serve also as benchmarks for assessing each country’s performance in implementing REDD+ activities.
Carbons pools included in the FREL
Aboveground biomass
Forest degradation
Peat decomposition
Belowground biomass
Litter
Dead Wood
Avoided deforestation
The plot shows the avoided deforestation area (hectares). This is calculated as the forest area that would have been cleared if deforestation trends of a reference period (baseline) had continued.
CO2 emissions from deforestation
The plot shows the estimated emissions of CO2 (million tons) associated with clearing of forest in the state.
Avoided CO2 emissions
The plot shows the avoided CO2 emissions (million tons) according to the forest carbon pools included in the FREL. This is calculated as the emissions that would have been released if deforestation trends of a reference period (baseline) had continued.
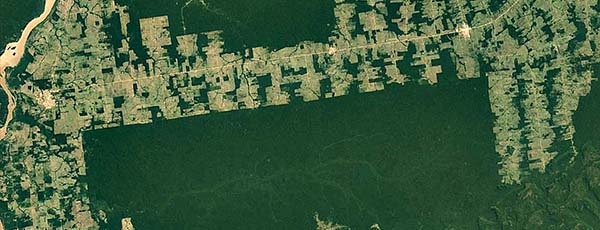
Landcover area
The plot shows the estimated area of landcover categories in the territory. Click on the classes for more details
-
 %tons
%tonsMain crop in agricultural production of the state
N/A N/A -
%tons
Second crop in agricultural production
N/A N/A -
%tons
Third crop in agricultural production
N/A N/A -
%tons
Fourth crop in agricultural production
N/A N/A
Value of economic activities and per capita income
Main agricultural products
Production (tons) of major crops in the state
The plot shows the yearly production (tons) of major permanent and temporary crops in the state.
Crop area (hectares) of major crops in the state
The plot illustrates the yearly planted area (hectares) of major permanent and temporary crops in the state.
Extractivism
The plot reports the yearly production (tons) of forest extractivist activities in the state. This includes the collection of Brazilian nuts, acai and rubber (latex).
| Cattle herd size: | |
| Slaughtered heads: | |
| Meat production (tons): | |
| Year: |
| Pig herd size: | |
| Slaughtered heads: | |
| Meat production (tons): | |
| Year: |
| Poultry herd size: | |
| Slaughtered heads: | |
| Meat production (tons): | |
| Year: |

| Value (thousands): | |
| Year: |
 Cattle
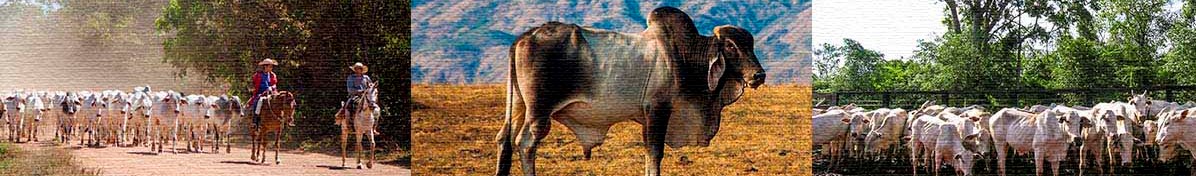
Cattle herd size
Cattle meat production
 Pigs
Pigs
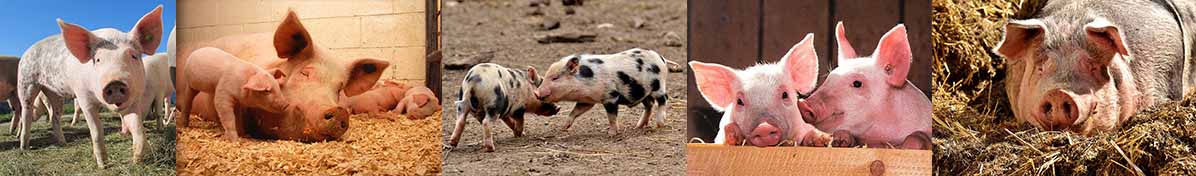
Pig herd size
Pig meat production
 Poultry (chicken and other birds)
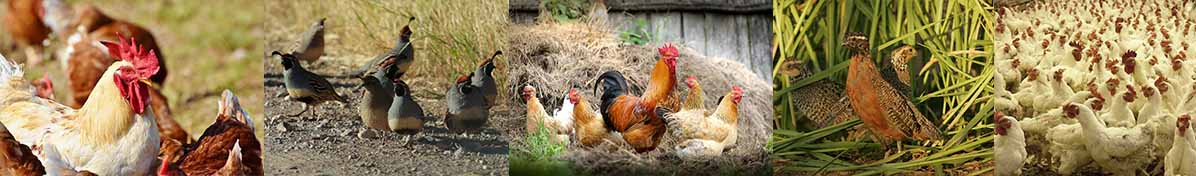
Poultry herd size
Poultry meat production
Aquaculture
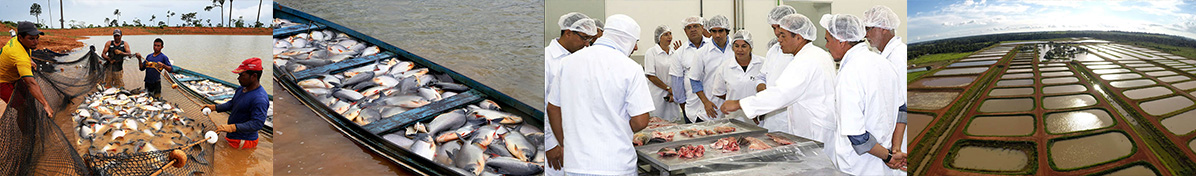
Aquaculture
Aquaculture production


Education
Poverty
Be part of this initiative
Indigenous territories
| Indigenous area | Ethnic group | Area (km2) | % inside the state |
|---|
Protected conservation areas
| Protected area | Area (km2) | % in the state |
|---|
| Select an indicator |
|---|
| Select a product |
|---|
Social, economic, environmental and productive information
Crop area (hectares) of major crops in the state
The plot illustrates the yearly planted area (hectares) of major permanent and temporary crops in the state.
Production (tons) of major crops in the state
The plot shows the yearly production (tons) of major permanent and temporary crops in the state.
Cattle heads
The plot illustrates the yearly planted area (hectares) of major permanent and temporary crops in the state.
Cattle production
Annual deforestation area
The plot illustrates the yearly deforestation area measured over the last years in the state. Activate the line series to visualize the accumulated deforestation in the state.
Annual deforestation rate(%)
The plot shows the estimated emissions of CO2 (million tons) associated with clearing of forest in the state.
CO2 emissions from deforestation
The plot shows the estimated emissions of CO2 (million tons) associated with clearing of forest in the state.
Landcover area
The plot shows the estimated area of landcover categories in the territory. Click on the classes for more details
| Indicator | Value | Source |
|---|
Access the spatial platform of the Green Jurisdictions Database to facilitate the monitoring of jurisdictions that are on their path to agricultural rural development.
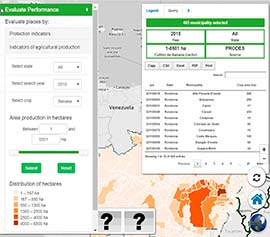
This map allows you to evaluate forest, agricultural production, and social indicators at the subnational level. Use the available layers or define specific search criteria to identify specific regions. Click on a district or municipality to see the production and forestry indicators on the right side panel.
Use the available layers or define specific search criteria to identify places performing according to your definition. Click on a district or municipality to see the production and forestry indicators on the right panel.
Go to the interactive map
See Our Investment Opportunities
Trading across borders
Avg OECD countries
Avg GCF states
| Distance to port (Km) | ||
| Time to export Border compliance (hours) |
Bad
Good
|
|
| Cost to export: Border compliance (USD) |
Bad
Good
|
|
| Time to export: Documentary compliance (hours) |
Bad
Good
|
|
| Cost to export: Documentary compliance (USD) |
Bad
Good
|
Starting a business
Avg OECD countries
Avg GCF states
| National Rank | ||
| Procedures (number) |
Bad
Good
|
|
| Time (days) |
Bad
Good
|
|
| Cost (% of income per capital) |
Bad
Good
|
Note: Doing business has not prepared a subnational report for the country of this jurisdiction. Reported values are representative of the country capital.
Dealing with construction permits
Avg OECD countries
Avg GCF states
| National Rank | ||
| Procedures (number) |
Bad
Good
|
|
| Time (days) |
Bad
Good
|
Note: Doing business has not prepared a subnational report for the country of this jurisdiction. Reported values are representative of the country capital.
Registering property
Avg OECD countries
Avg GCF states
| National Rank | ||
| Procedures (number) |
Bad
Good
|
|
| Time (days) |
Bad
Good
|
Note: Doing business has not prepared a subnational report for the country of this jurisdiction. Reported values are representative of the country capital.
Paying taxes
Avg OECD countries
Avg GCF states
| National Rank | ||
| Procedures (number per year) |
Bad
Good
|
|
| Time (hours per year) |
Bad
Good
|
|
| Total tax and contribution rate (% of profit) |
Bad
Good
|
Note: Doing business has not prepared a subnational report for the country of this jurisdiction. Reported values are representative of the country capital.
Forest protection
Avg GCF states
| Index value |
Bad
Good
|
|
| Change risk |
Bad
Good
|
|
| Average rate risk |
Bad
Good
|
Starting a business
Starting a business index measures the time and cost required to formally operate a limited liability company in the jurisdiction. It includes:
- Procedures: interactions of the company founders with external parties to register the company
- Time:calendar days that entrepreneurs can expect to go through to start up and formally operate
- Cost: percentage of the economy’s income per capita needed to complete these procedures
The company is assumed to be a limited liability company, 100% domestically owned by five people and performs general industrial or commercial activities.
The panel presents the ranking of the jurisdiction within the country and allows the comparison of the indicators with the average performance of GCF jurisdictions and OECD countries.
Dealing with construction permits
Dealing with construction permits records the time and cost required to build a warehouse. This includes:
- Procedures: interactions of the building company employees with external parties to legally build a warehouse, including obtaining necessary licenses and permits, completing required notifications and inspections, and obtaining utility connections.
- Time: calendar days needed to complete all the procedures involved in getting a construction permit
The warehouse is assumed to be used for general storage activities, such as storage of books, will have two stories and measure 1,300 square meters.
The panel presents the ranking of the jurisdiction within the country and allows the comparison of the indicators with the average performance of GCF jurisdictions and OECD countries.
Registering property
Registering property records the ease with which businesses can purchase and transfer a property from another business. This includes:
- Procedures: interactions of the buyer or the seller with external parties
- Time: calendar days needed by lawyers, notaries or registry officials to complete the procedure
It is assumed that the property has a value of 50 times income per capita, is fully owned by the owner, has no mortgages and is duly registered.
The panel presents the ranking of the jurisdiction within the country and allows the comparison of the indicators with the average performance of GCF jurisdictions and OECD countries.
Paying taxes
Records the taxes and mandatory contributions that a medium-size company must pay or withhold in a given year, as well as the administrative burden of paying taxes and contributions. This includes:
- Procedures:number of payments necessary for a local company to pay all taxes per year
- Total tax and contribution rate: amount of taxes and mandatory contributions borne by the business in the second year of operation, expressed as a share of commercial profit.
- Time:number of hours taken to prepare, file and pay corporate income tax, sales tax, and labor taxes, including payroll taxes and social contributions.
It is assumed that the entity paying tax is a local limited liability, taxable company, which performs industrial or commercial activities.
The panel presents the ranking of the jurisdiction within the country and allows the comparison of the indicators with the average performance of GCF jurisdictions and OECD countries.
Trading across borders
This panel records the time and cost associated with the logistical process of exporting and importing goods (excluding tariffs). This consideres time and cost for documentary compliance, border compliance and domestic transport.
It is assumed that a shipment is located in a warehouse in the largest business city of the exporting economy and travels to a warehouse in the largest business city of the importing economy. It is assumed that each economy imports a standardized shipment of 15 metric tons of containerized auto parts and the value of the shipment is assumed to be $50,000.
Doing business does not measure this indicator at the subnational level, therefore the data shown here represents the value of the international trade originating from the largest business city of the economy.
Forest protection
The matrix shows the score of investment opportunities considering forest protection in the GCF states. The score ranges from 0 to 100 where higher values indicate better performance in forest protection over the last years. The score is calculated based on the annual deforestation measured in the state as an index that combines:
- Average deforestation rate (%) considering the 3 most recent annual reports
- Variation of deforestation with respect to a historical deforestation baseline.
Official deforestation figures are used wherever possible. To see the sources of deforestation for each state please see the environmental section of the profile.
Forced labor